How to Read Knitting Charts
There are multiple ways to convey a design in knitting, including different patterns and knitting charts. Both have their pros and cons, but knitting charts are the best for visualising what the end product may look like while you work. Don’t be scared away by the grid and symbols, reading these charts is easier than you think.
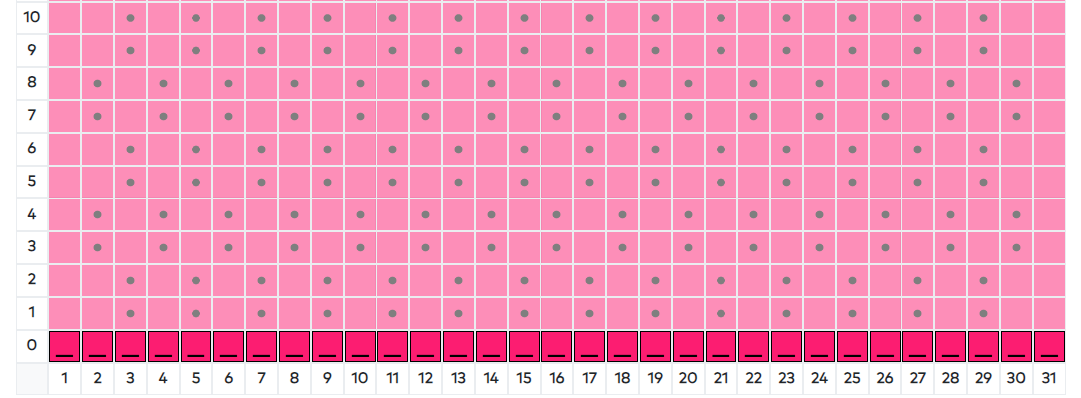
Firstly, let’s look at a chart and cover the basics. Knitting charts are followed by working from the bottom up just like any piece, meaning that the bottom row of a knitting chart is your first row, and similarly each box is translated to one stitch. A knitting chart always shows you the knitting from the right side. When reading a knitting chart, you work from right to left on odd numbered rows and left to right on even numbered rows.
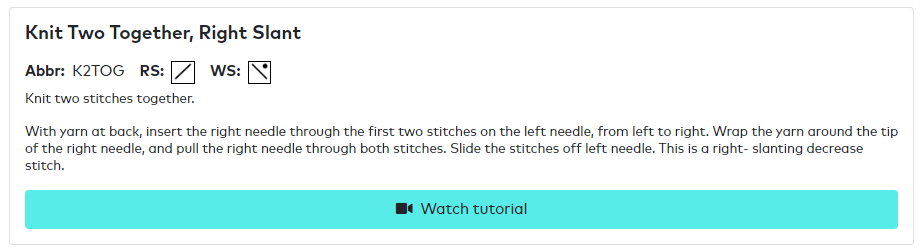
Each stitch will be marked out by a symbol in each box, be careful though, not every chart uses the same symbols for the same stitch. The Knit It® Technique Guide is a complete list of all stitches used in Knit It Smart Patterns. It includes the stitch, abbreviation, description, symbol and a video tutorial.
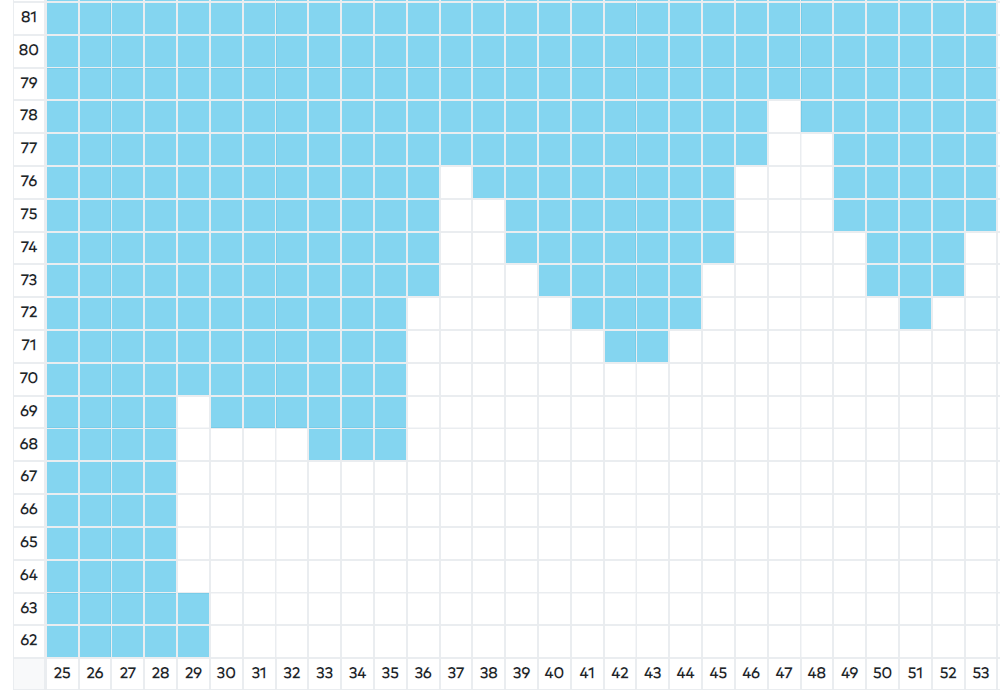
Sometimes you get charts for complicated stitch patterns and other times you get them to show a colour work pattern. Usually with these colour work charts, all stitches are knitted in the same stitch pattern, meaning these charts usually tell you colour change rather than stitch change. Knit It® Smart Patterns display both the colour and stitch on the chart.
Knitting charts are a visual alternative to the usual text-based patterns, for some projects it can be easier to see what the final product should look like as you go, making it a better format for more visual learners.
Sometimes it can be hard to follow an intricate pattern, but now you know how to follow a knitting chart, knitting fancy fabrics is so much easier.